

What Are Candle Sticks, Candle Sticks Chart pattern pdf complete guide | Basic of Candle sticks & Candle Stick Identification

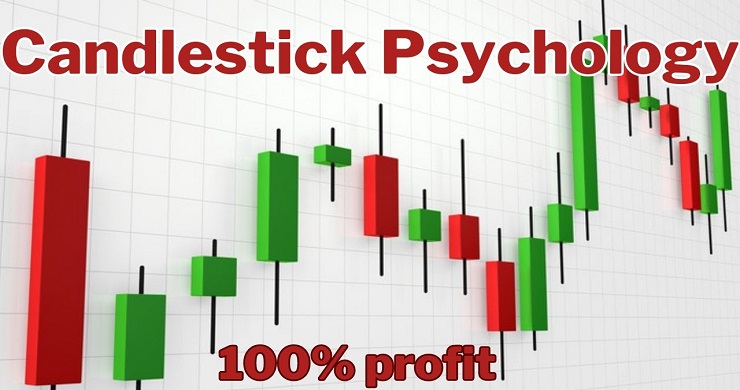
What are Candlesticks?
Take simply, candlesticks are a way of communicating information about how price is moving. Candlesticks play are very important role in trading, Because candlesticks show human emotions. where the price is going, uptrend and downtrend. Candlestick charts are available on Crypto skillside trading platforms for all assets individuals can trade on the platforms. Below is a sample of a candlestick chart derived from the ThinkForex web trading platform:

This chart shows price on the right (vertical) axis, and time on the bottom (horizontal) axis. Moreover, the chart is made of bars that have little lines stemming from the top and the bottom; these are known as candles. The candle conveys four pieces of information:
- The open price 3. The high price
- The close price 4. The low price
What is Candle Sticks?
Candles refer to that information for a specific unit of time. For instance, the chart above is a daily chart; each chart represents one day. And thus, each candle constitutes, the open, close, high, and low price for that given day. The horizontal axis at the bottom of the chart can be used to understand which day corresponds to which candle. Below is an image that illustrates how those four pieces of information open, low, high, and closed for a given period of time are visualized in the context of a candle:

The wicks, or shadows, are the thin lines that go outside the rectangular body of the candle. They represent the high and the low price during that period.
The colors of the candles are also significant in understanding whether the open price was higher or lower than the close price. If the candle is red, or denoted as bearish in some other manner, this means that the open price is lower than the close, and the opposite is true if the candle is green, or denoted as bearish.

Consider the candle above. The absolute highest point on the candle, the top of the upper line above the rectangular body, is the high price; the absolute lowest point shows how far the price fell during the time period in question. The top of the candle is the opening price of the time period, while the bottom of the candle is the closing price. Thus, from this candle, we see that price rallied and fell from its open but bears were ultimately able to push it lower than the open, while bulls came in before the close to push the price up a bit.
Why do Candlesticks Work?
Price action traders rely on candlesticks because they convey a great deal of information about each trading period in a visual format that is easy to interpret, allowing traders to compare it behavior of prices in different time frames with a glance at a price action chart. Each candlestick can be “read” as a meaningful part of the developing understanding of price. They communicate the “market sentiment”: whether (and to what extent) bears or bulls were in control, and how far traders managed to push price in both directions. For example, a long candle’s body with no wicks indicates a definitive shift in this struggle for
power, whereas a candle with a long upper wick beyond its body indicates a more contentious period with an effort by bulls to push price higher that was pushed back by pressure from bears before the close of the candle. Certain re-occurring candlestick patterns have become popular among traders as reliable signals of future market behavior. This guide is intended as an introduction to some of these patterns, which helptraders make sense of market conditions and recognize advantageous times to enter trades.
The ability to read candlesticks allows the price action trader to become a meta-strategist, taking into account the behaviors of other traders and large-scale market-movers. In other words, candlestick patterns help traders.
FAQ?
Which candle stick type is best?
The candlesticks are useful when trading as they show four price points - open, close, high, and low - throughout the period the trader specifies.
Can you make money candlestick trading?
Yes of course, it is possible to trade with just candlesticks. To set stop loss and take profit levels, you can use support and resistance levels, trend lines, and other chart patterns to determine where to place your orders.
Are candlestick patterns profitable?
Yes, candlestick trading is a profitable technique used in trading charts. mostly traders focus on candlesticks' behavior and their movements, and price action.
d the candlestick chart pattern in a PDF full complete guide click below link and dowload
share this article rate on google thanks!
Candlestick charts patterns pdf free download